Welcome to our Smart Engineering Industrial IIoT Automation Embedded Systems AI & ML Company!
ENTERPRISE IOT PLATFORM & EDGE AI ENGINE

Scale Your IoT Ecosystem from First Wire to Global Deployment

Prototype, deploy, and scale connected devices effortlessly. MioSuite connects your hardware to the cloud with ready-to-use embedded Linux OS, Android, and web apps, real-time control, and enterprise device management—whether you're shipping your first prototype or millions of units.

Accelerate time-to-market with MioSuite: a full-stack IoT platform combining resilient edge connectivity, secure multi-tenant hosting, and low-code app deployment. Stop rebuilding backend infrastructure and focus on your hardware.

PLATFORM BLUEPRINT

Ecosystem Architecture

MULTI-TENANT ENGINE

CloudyAI / MioSuite Operational Hub

The centralized multi-tenant cloud engine delivering live telemetry ingestion, fleet orchestration, low-code rule automation, role-based governance, and incident dispatch.

EMBEDDED EDGE OS

EdgeAI OS & Application Suite

Embedded edge device software powering PLCs, smart gateways, and field sensor hubs. It handles high-frequency data sampling, deterministic safety routines, and local fault handling before piping telemetry upstream.

MOBILE & BLE BRIDGE

DeviceConnect (iOS & Android)

A mobile provisioning and control bridge that communicates directly with EdgeAI over Bluetooth (BLE) for field-level onboarding, Wi-Fi/cellular network configuration, and local actuator checks.
FEATURE DEEP DIVE

Core Platform Capabilities & Modules

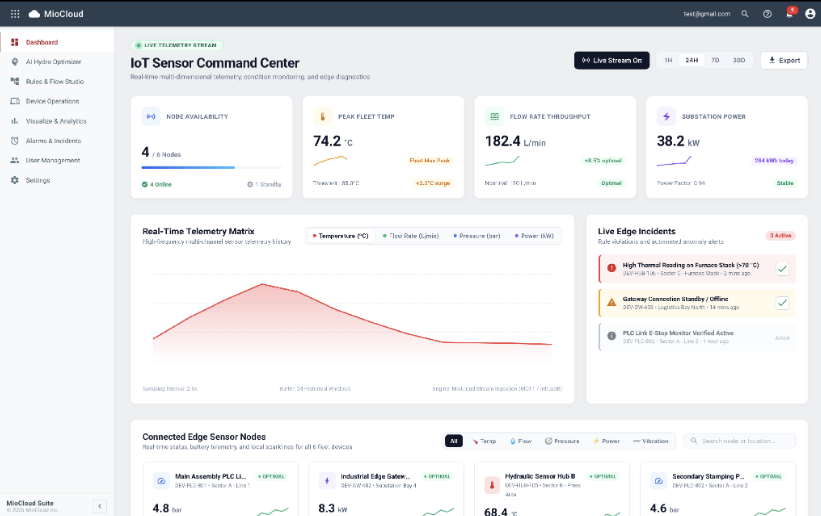
IoT Sensor Command Centre

Command Hub

Live KPI & Grid

OPERATIONAL VISIBILITY & TELEMETRY

IoT Sensor Command Centre

  • Delivers live operational visibility via synchronized KPI cards
  • Streams high-frequency multi-channel telemetry
  • Displays a filterable edge node grid equipped with localized sparkline trendlines for fast cross-parameter diagnostics.
HARDWARE MANAGEMENT & CONTROL

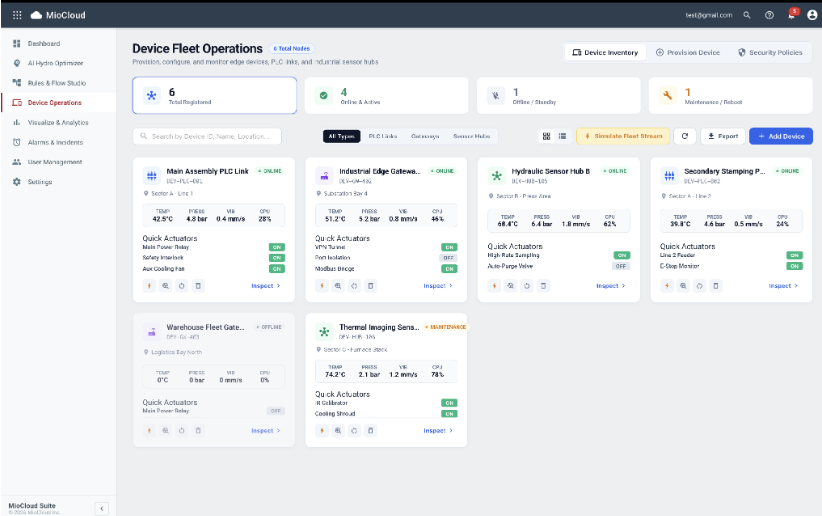
Device Fleet Operations & Edge Diagnostics

  • Manages connected hardware assets—from industrial gateways to hydraulic hubs and PLC links.
  • Exposes critical node vitals (temperature, pressure, vibration, CPU load) alongside direct Quick Actuator toggles (e.g., Main Power Relay, Safety Interlock, Aux Cooling Fan, Modbus Bridge).
Device Fleet Operations & Edge Diagnostics

Fleet Operations

Actuator Toggles

Custom Rules & Automation Flow Studio

Flow Studio

Node-RED Engine

LOW-CODE AUTOMATION & ENGINE

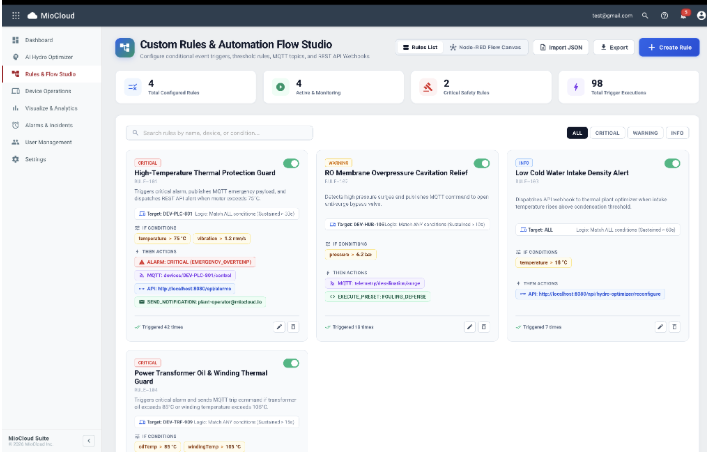
Custom Rules & Automation Flow Studio

  • Combines a condition/trigger-action rules engine with a visual Node-RED Flow Canvas.
  • Processes complex multi-condition event logic (e.g., sustained temperature >75C and vibration >1.2 mm/s) to trigger critical MQTT payloads, REST API webhooks, and automated email notifications.
SAFETY & TRIAGE MANAGEMENT

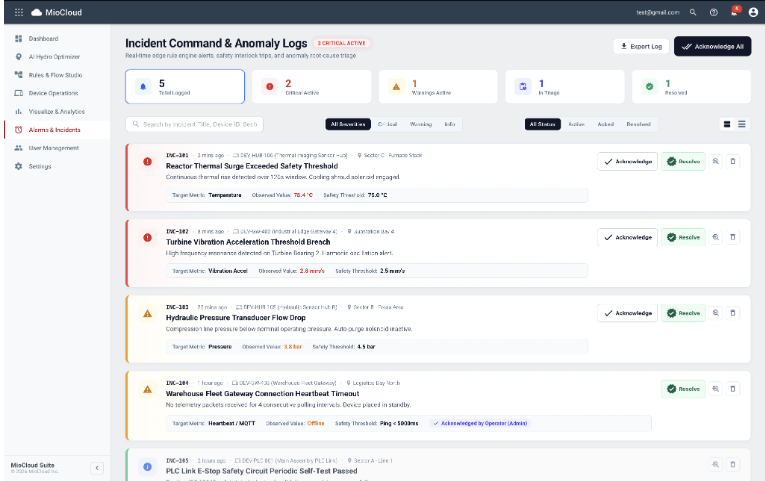
Incident Command & Anomaly Logs

  • Tracks real-time safety interlock trips, gateway heartbeats, and threshold breaches sorted by severity (Critical, Warning, Info).
  • Provides an operational triage loop featuring root-cause descriptions, target vs. observed metrics, and integrated "Acknowledge" and "Resolve" actions.
Incident Command & Anomaly Logs

Incident Command

Anomaly Logs

Personnel & Access Control (RBAC)

RBAC Security

Access Control

ENTERPRISE SECURITY & GOVERNANCE

Personnel & Access Control (RBAC)

  • Manages multi-tenant operational security across granular engineering personas (Administrators, Automation Engineers, Plant Operators, Data Analysts).
  • Enforces role-specific permissions restricting relay actuation, telemetry export, user administration, and firmware flashing.

Telemetry & Edge Ingestion Sync

  • Features fine-grained telemetry rate tuning (from 1.0s Ultra to 10.0s Low Bandwidth modes) and sliding browser buffer windows.
  • Supports automated backend synchronization directly into PostgreSQL and timeseries DB engines for enterprise-grade historical auditing.
GRID VISIBILITY & PLATFORM DEMO

Fleet Health & Operational KPI Tracking

  • Aggregates high-level system indicators into immediate-glance summary cards (e.g., node availability, thermal limits, flow throughput, and power efficiency).
  • Compares incoming measurements against operational baselines and safety thresholds to expose performance surges or anomalies instantly.

High-Frequency Telemetry Ingestion

  • Visualizes synchronous, multi-channel sensor data (temperature, pressure, power, and flow) via live, streaming time-series graphs.
  • Buffers short-interval device metrics to help operators spot transient spikes, degradation trends, or shifts in operating conditions over time.

Edge Anomaly & Incident Management

  • Captures edge-level rule violations and alert triggers in an active incident feed.
  • Color-codes events by severity (critical breaches, connectivity timeouts, and operational status logs) with built-in acknowledgment actions to streamline triage and resolution.

Granular Node Fleet Visibility

  • Displays individual edge nodes, industrial gateways, and controller hubs in a searchable, filterable grid.
  • Provides device-level health tags, key output readings, and localized trendlines (sparklines) for quick cross-parameter diagnostics across vibration, power, and pressure.

Platform Video

Live Walkthrough